Lively Azure Dashboards with Azure Resource Graph
Learn how to utilize Azure Resource Graph to bring life into your Azure Dashboards. The blog post will help you set up a dashboard that visualizes the recent changes in all subscriptions and also shows orphan resources.

If you have ever used Microsoft Azure you've undoubtedly seen an Azure Dashboard. Whenever you open the Azure Portal, you land on a dashboard. It typically visualizes all your resources and resource groups. It also displays various shortcuts to other places in the Azure Portal. But besides the default look, have you ever wondered how far you can go to customize those dashboards?
In this post, we'll explore a few ways that might help you make your dashboards more dynamic by using Azure Resource Graph which offers a powerful way to query resources across subscriptions by using a subset of the Kusto Query Language (KQL).
Azure Dashboards gotchas
Before I show you the Kusto queries, let me share a few quirks the portal has at the time of writing this.
#1 Not all available tiles show up in Tile Gallery
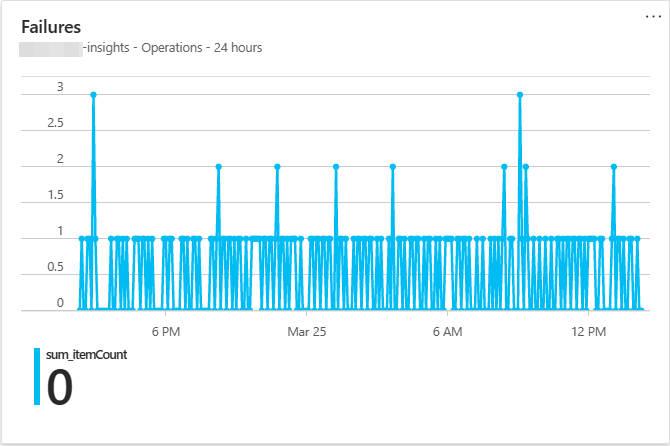
When you edit an Azure Dashboard, you would expect to see all available tiles when clicking on the "Add tiles" button. But that's not the case - some tiles can only be embedded in a dashboard by hitting that pin icon that can be present somewhere on the page (blade) of some resources. Here's an example of App Insights failures, and it shows up twice:
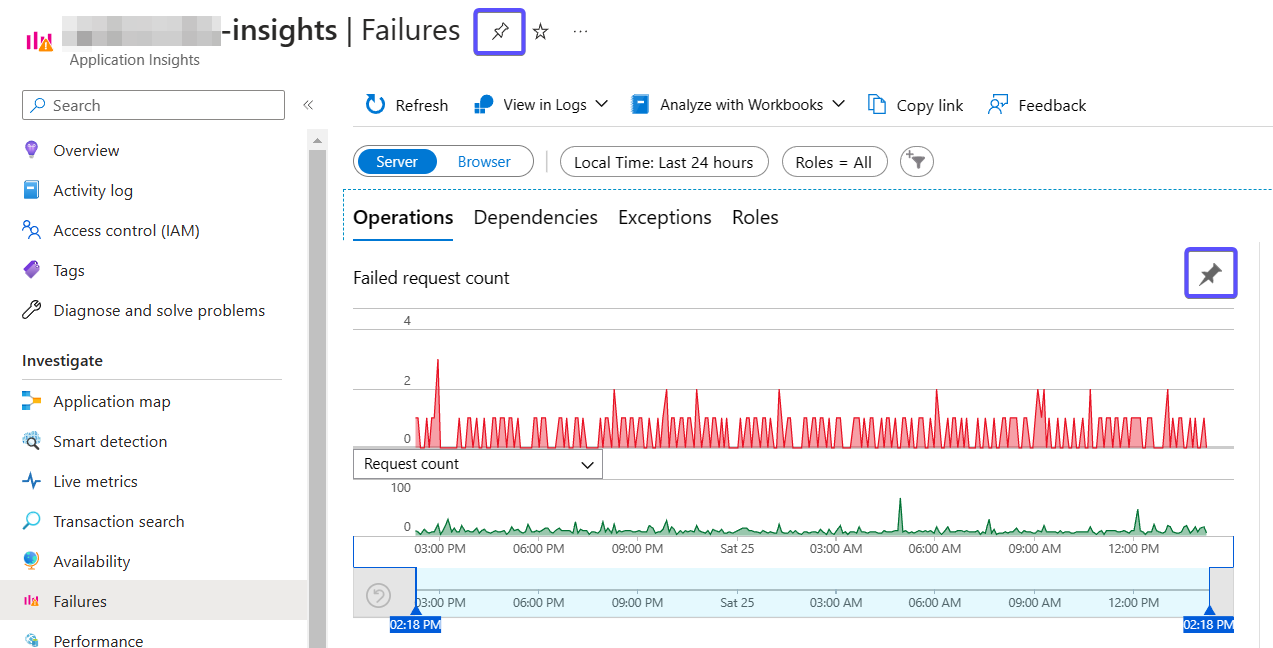
Here is how it looks when pinned to a dashboard:
But it is not available in the Tiles Gallery:
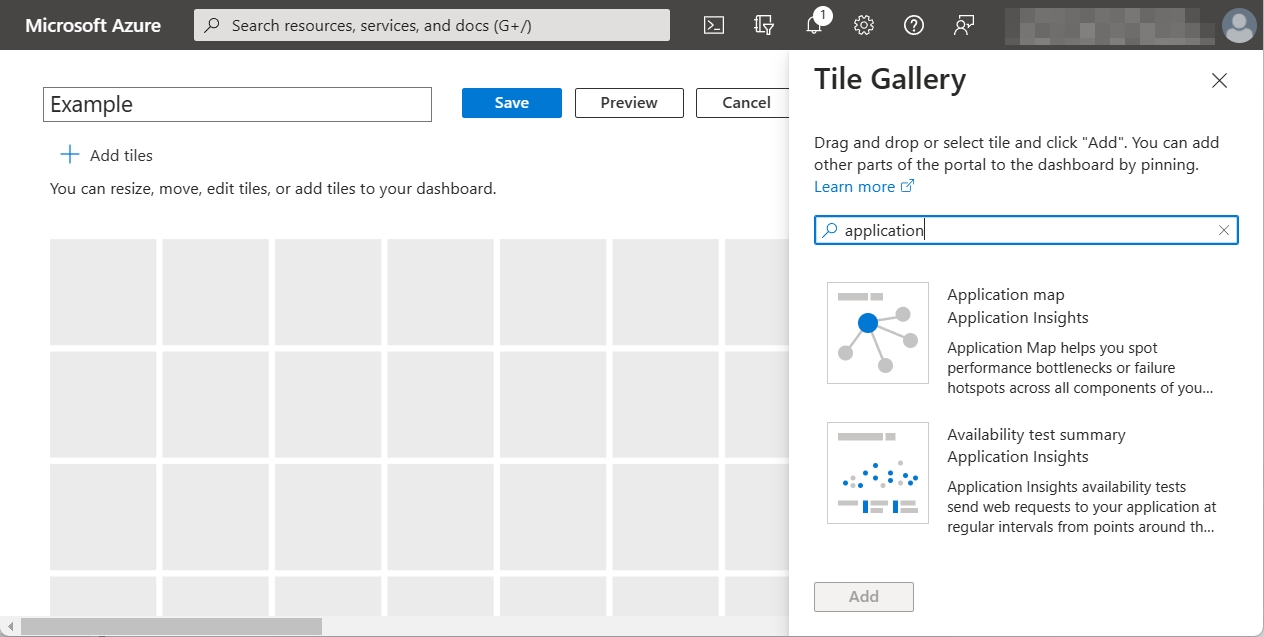
So keep an eye out for pinnable resources while clicking around in the Portal.
#2 Resource Graph tiles
This one is specific to the tiles that visualize the result of a Resource Graph query. When you click on the tile, regardless of whether it is a grid, a chart, or a single value, it opens an Azure Resource Graph Explorer query page that lets you edit the Kusto query. At the bottom, you configure how you want this part to look in the dashboard. Once you are satisfied with what is shown in the Results tab, make sure to update the pinned part on the dashboard and set the toggle for formatted results accordingly:
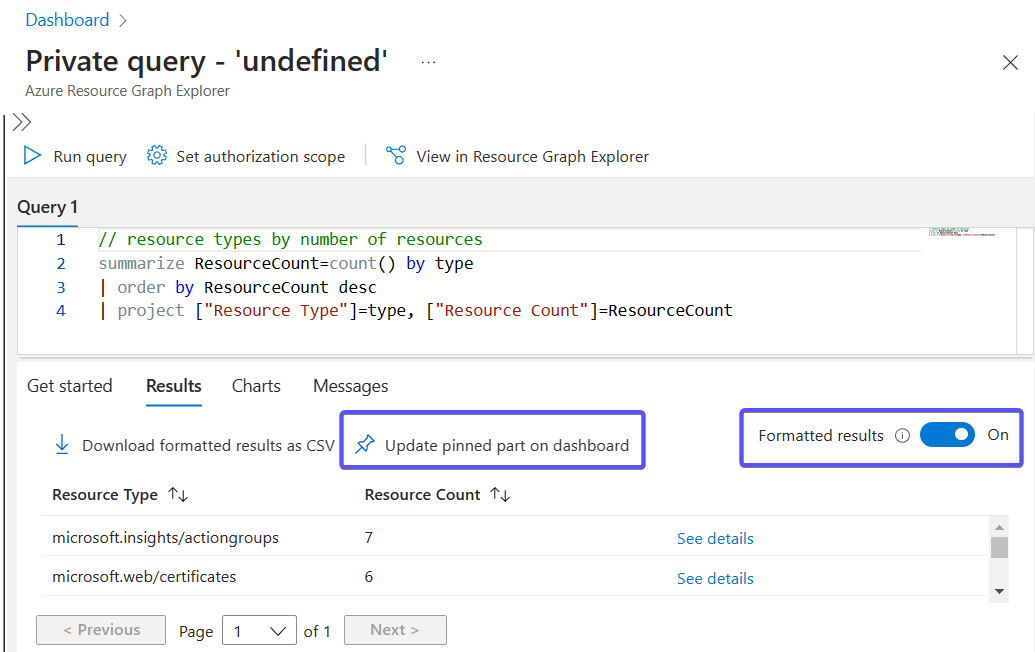
If switched on, Formatted results will try to interpret the columns returned by the query and if possible, will replace raw text and identifiers with meaningful names or clickable links. You will have to help it by using column names that it can make sense of. For the queries below, make sure to have this enabled.
Now off to the queries!
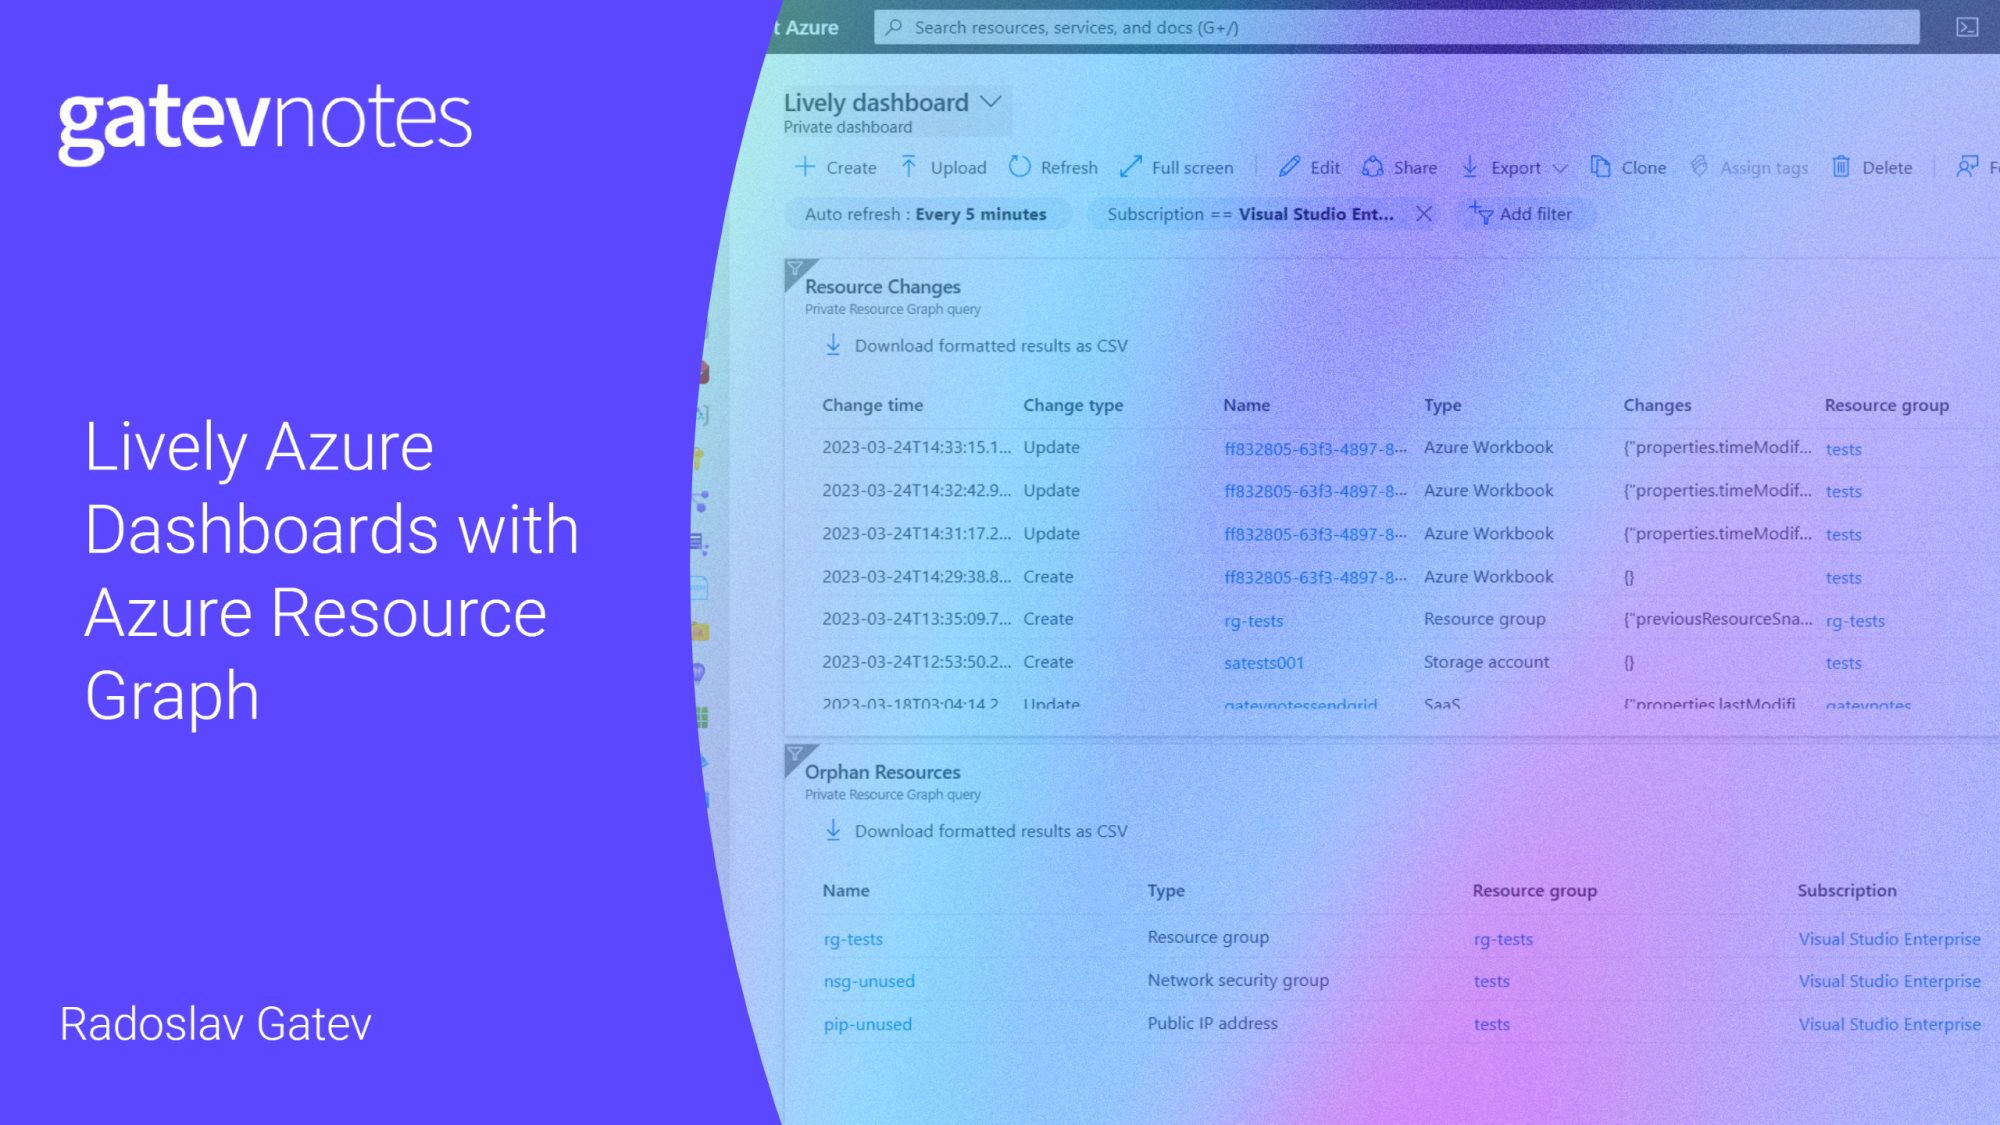
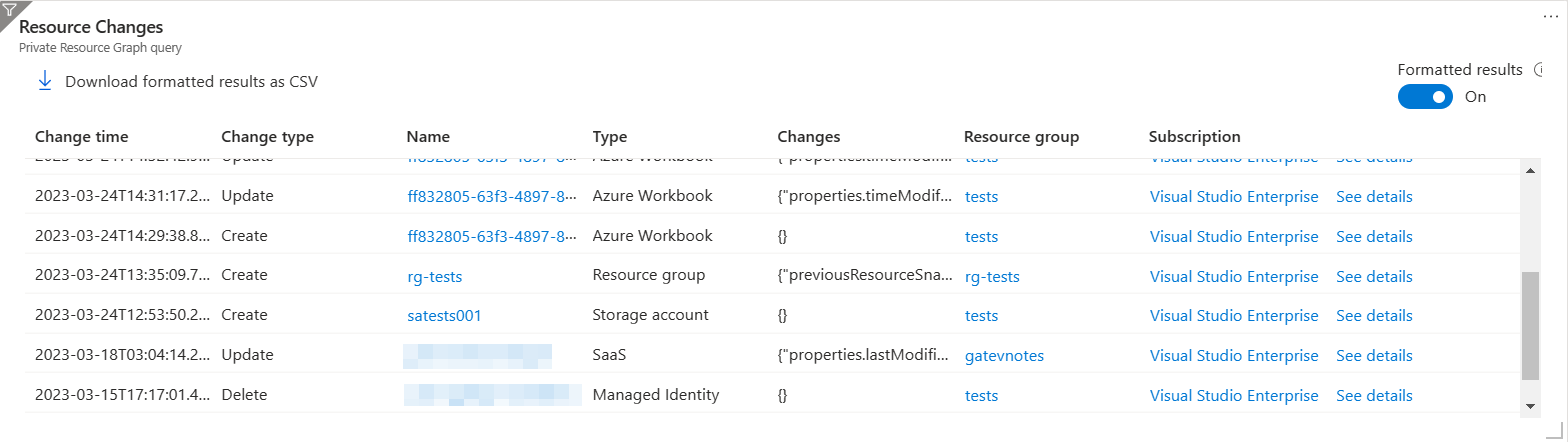
Show the latest resource changes
If you are working on automation that touches some properties of an Azure resource, you might be only using the Azure Portal to verify that the changes were applied as you expect. But whenever you open the portal, you struggle to find where that resource is. Or maybe you just want to audit the recent changes performed on your resources and resource containers (resource groups, subscriptions, management groups).
If you want to have quick access to all recent changes, this query is for you:
resourcechanges
| extend changeTime = todatetime(properties.changeAttributes.timestamp)
| project
    ['Change time'] = changeTime,
    ['Change type'] = properties.changeType,
    id = properties.targetResourceId,
    type = properties.targetResourceType,
    Changes = properties.changes,
    resourceGroup,
    subscriptionId
| union kind = inner
    (
    resourcecontainerchanges
    | extend changeTime = todatetime(properties.changeAttributes.timestamp)
    | project
        ['Change time'] = changeTime,
        ['Change type'] = properties.changeType,
        id = properties.targetResourceId,
        type = properties.targetResourceType,
        Changes = properties.changeAttributes,
        resourceGroup,
        subscriptionId
    )
| order by ['Change time'] desc
The changes are sorted by starting with the most recent ones:
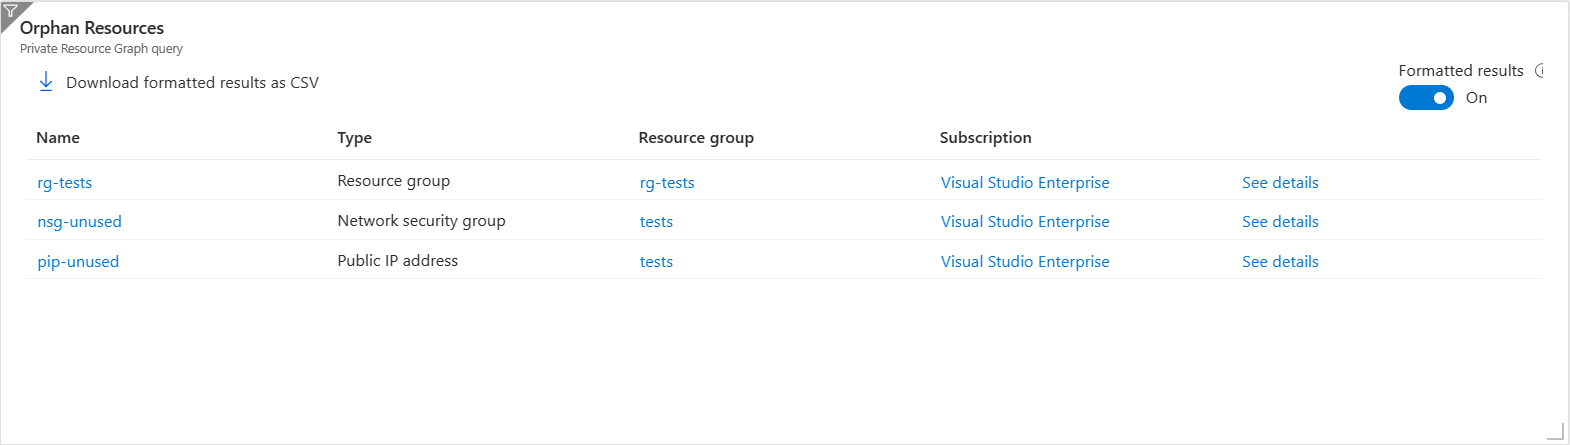
List Orphan Resources
Redundant resources can pile up on your Azure bill over time and you may not realize it. They are sometimes left as residual resources from a bigger deployment: a public IP that is not used anywhere, or a disk that is not attached to a virtual machine, just to name a few. Those resources are called orphan resources. Some of them like Disks or Azure App Service plans are more expensive than others which simply clutter your subscriptions.
I found Dolev Shor's repo which serves as a collection of some Kusto queries for finding orphaned resources. However, I had to merge all queries into one so that you can see them all in a single Resource Graph grid tile:
resources
| where (type has "microsoft.compute/disks" and managedBy == "" and not(name endswith "-ASRReplica" or name startswith "ms-asr-" or name startswith "asrseeddisk-"))
    or (type has "microsoft.network/networkinterfaces" and isnull(properties.privateEndpoint) and isnull(properties.privateLinkService) and properties.hostedWorkloads == "[]" and properties !has 'virtualmachine')
    or (type =~ "microsoft.network/publicipaddresses" and properties.ipConfiguration == "" and properties.natGateway == "" and properties.publicIPPrefix == "")
    or (type =~ "microsoft.network/networksecuritygroups" and isnull(properties.networkInterfaces) and isnull(properties.subnets))
    or (type =~ 'Microsoft.Compute/availabilitySets' and properties.virtualMachines == "[]")
    or (type =~ "microsoft.network/routetables" and isnull(properties.subnets))
    or (type =~ "microsoft.network/loadbalancers" and properties.backendAddressPools == "[]")
    or (type =~ "microsoft.web/serverfarms" and properties.numberOfSites == 0)
    or (type =~ "microsoft.network/frontdoorwebapplicationfirewallpolicies" and properties.frontendEndpointLinks == "[]" and properties.securityPolicyLinks == "[]")
    or (type =~ "microsoft.network/trafficmanagerprofiles" and properties.endpoints == "[]")
| project id, type, resourceGroup, subscriptionId
| union kind = outer
    (
    resourcecontainers
    | where type =~ "microsoft.resources/subscriptions/resourcegroups"
    | extend rgAndSub = strcat(resourceGroup, "--", subscriptionId)
    | join kind=leftouter (
        resources
        | extend rgAndSub = strcat(resourceGroup, "--", subscriptionId)
        | summarize count() by rgAndSub
        )
        on rgAndSub
    | where isnull(count_)
    | project id, type, resourceGroup, subscriptionId
    )
It is capable of finding the following types of orphaned resources:
- Disks
- Network Interfaces
- Public IPs
- Resource Groups
- Network Security Groups (NSGs)
- Availability Sets
- Route Tables
- Load Balancers
- App Service Plans
- Front Door WAF Policy
- Traffic Manager Profiles
When pasted into a grid tile, it is displayed like this:
Download this dashboard
If you want to download a dashboard with both queries and import it right away, you can find it here.
Conclusion
I hope those queries are useful to you. If you have some other favorite Resource Graph queries that you embed into your Portal Dashboards, share them as a comment and I will consider including them in the post.